
Let’s Talk about Climate Change in the Gulf of Maine…
The waters we sail in, the Northeast, USA, are some of the fastest warming waters in the world. Lately, I’ve been paying attention and try to keep tabs on how climate change is affecting our area. My personal perception, in coastal NH, is that there’s no denying that the weather has “felt” differently over the past few seasons. The weather gets warmer faster in the spring, stays warm well into October-November, and winter’s are all-around milder, but with wild cold snaps and dramatic ice and snow events. The snow hardly sticks around anymore, not like I remember as a kid in the ‘90s, usually melting back to mud and bare, brown grass within a few days.
Tides have been markedly higher. I’ve witnessed Portsmouth, NH and Portland, ME suffering fairly frequent winter flooding. Sea walls, such as the one guarding Little Harbor in New Castle often seem like they were built too short for severe winter storms that seem to occur now once or twice a year. These kinds of events just seem like they’ve become the new normal. It’s become a yearly tradition for me to drive to Wentworth Marina to watch the waves come into the harbor. Old-timers I talk to tell me that the storms weren’t like this in the past.
Perception is one thing, and easily twisted by short-term events. That’s why it’s important to turn to the experts who track weather patterns. Sensitive instruments measure sea surface temperature using buoys and satellite data, precipitation levels are tracked and measured using rain gauges at weather stations, and atmospheric air temperatures as measured using sensitive surface thermometers, weather balloons, and satellites.
I think that weather buoys, like the Portland Buoy, are no stranger to most mariners. They provide reliable data about wind and wave conditions at sea. I remember checking the Portland Buoy religiously as a kid to monitor conditions for surfing at the beach. They’ve also allowed climate researchers to log detailed climate data for years, allowing them to assemble datasets to study changes in climate.

NOAA weather buoys, like the Portland Buoy (44007) pictured here, provide a host of accurate weather data at sea, including sea surface temperatures at a depth of 6 FT. Buoys at this location provide weather and sea conditions data stretching back to 1982.
Reliable Climate Information
Recently, while on a sailing vacation in Maine, I stumbled across a news article that announced the release of UMaine’s Climate Reanalyzer tool. The tool is similar to what I envision American Mainsail’s Sailing Knowledge Base to be: a one stop shop for reliable information about sailing and sailboats. UMaine’s Climate Reanalyzer is a one-stop shop for climate data. Basically, UMaine assembled the major climate data resources and put them together under one roof. Then they made it accessible by allowing users to graph the data and focus it on the North Atlantic.
Climate Brief - Mapping weather-related extreme events and exploring climate change’s impact on them
Sea Change: Bounty in the Gulf of Maine (NOVA Documentary)
Unprecedented Warming
It only took about five minutes of poking around on UMaine’s Climate Reanalyzer to find a very applicable and troubling graph for anyone involved with the waters of Maine. I’m copying it here for reference, but feel free to follow the “Daily Sea Surface Temperature” link above to reproduce it. This graph is assembled using a variety of ship measurement, buoy measurement, and satellite measurement data. The “North Atlantic” area measured is a huge swath of ocean, essentially the entire North Atlantic: a square from 0-60°N and 0-80°W. The square stretches across the entire Atlantic, the most south-easterly side falling roughly in Ghana, Africa and the most north-westerly side falling just west of the southern tip of Greenland.
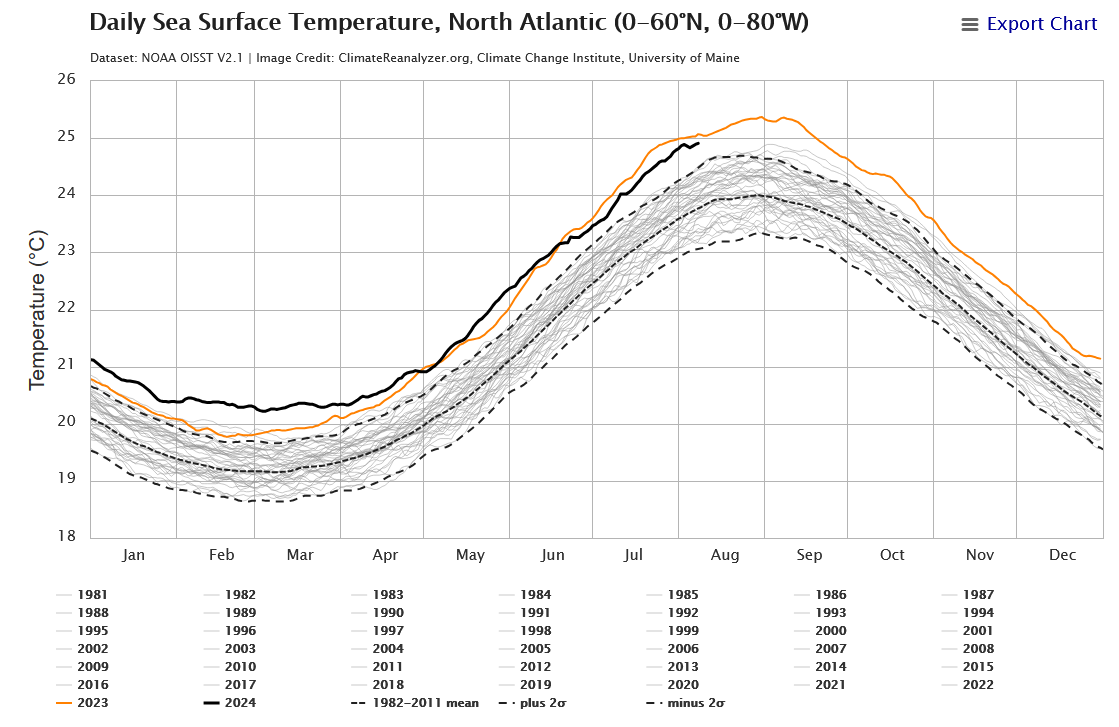
Daily Sea Surface Temperature - North Atlantic - Data as of 8/9/2024.
Notes: 20°C = 68°F, 22°C = 71.6°F, 24°C = 75.2°F, 26°C = 78.8°F
Orange line - 2023 North Atlantic Sea Temperatures
Black Line - 2024 North Atlantic Sea Temperatures,
Center Dotted Line - Average Sea Temperature between 1982 and 2011
Bounding Dotted Line - 95% (2-sigma) confidence interval of sea temperatures between 1982 and 2011. This is a statistical term that means that, given a “normal” year, we could expect the sea temperature to fall between these lines with a 95% confidence.
What’s even more troubling about this graph, is that if you hover over the real graph (it won’t work on this graph, since this is just a picture), you’ll find that the coolest ocean temperatures occurred during the earlier parts of the dataset (in the early- to mid- 90’s), and the warmest years occurred in the later parts of the data (in the early 2020’s). This graph isn’t showing “normal” years, the ocean was warming fairly consistently roughly from the beginning of the dataset to the end, with the last three years (starting in August 2021) showing accelerated warming. Last year to the current year (2023 and 2024) shows a remarkable pace of warming. This kind of ruthlessly accelerating warming might be outliers that give way to more gradual warming. Then again, they might not. Scientists say that August will by a key turning point for this trend. The accelerated pace of warming is likely due to regularly scheduled warming coupled with strong El Niño effects. Other sources say that climate scientists can’t really explain this trend of recent warming with existing climate models. If the elevated warming persists through the end of La Niña, scheduled to end this month (August, 2024), climatologists will consider us to have entered a new climate regime.
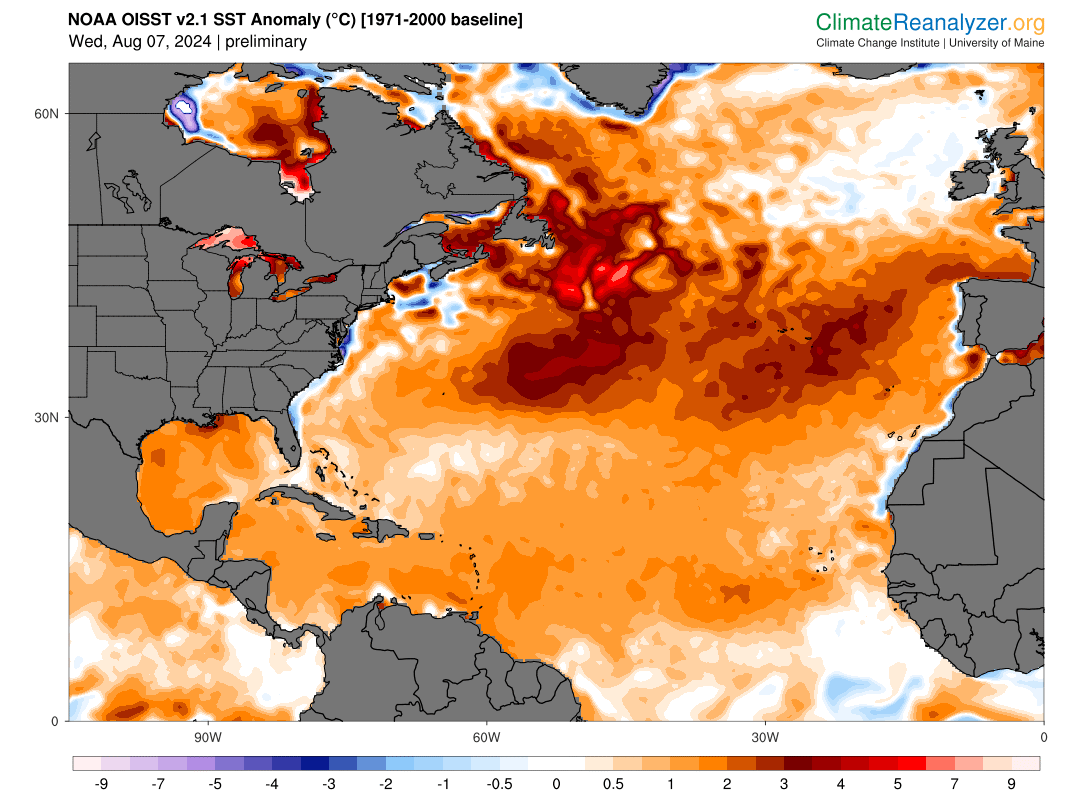
Sea Surface Temperature Anomoly - This map shows the temperature anomoly by location. Notice that much of the most northerly part of the North Atlantic is experiencing significantly warmer waters. The Gulf of Maine itself is between three and four °C higher than normal. In the warmed areas, this corresponds to sea surface temperatures of around 68°F, vs. a normal temperature, for this time of year, of between 60°-63°F.
Conclusions and Broader Perspectives
In all honestly, I’ve had this short article queued up for quite a while. I’ve faced a lot of trouble figuring out how to conclude it, or what conclusions that we can even draw in the face of accelerating climate change.
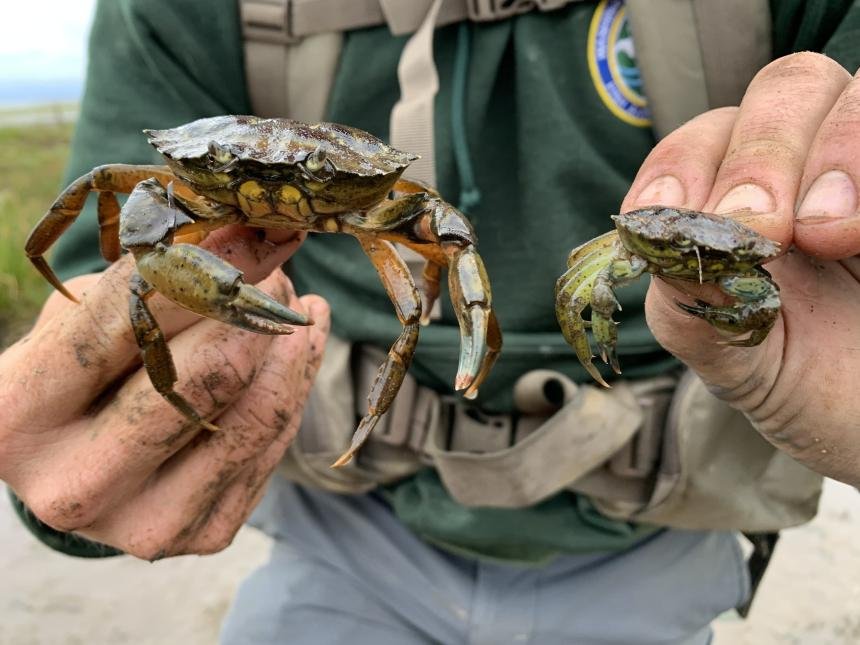
European Green Crab - Originally brought to New England in the ballast of old sailing ships coming from Europe, these crabs are everywhere in New England waters and do significant damage to the habitat of native crabs, clams, and other species. I took up recreational lobstering briefly in the summer of 2023 and caught these guys by the bushel. They thrive in warmer waters.
I don’t think I’m alone in my difficulty of drawing conclusions. The world is struggling to understand, cope with, and plan for the effects of climate change. Recently, I spent some time in Vinalhaven, ground-zero for a massive debate raging between environmentalists and many individuals in the lobstering community there. Most of the fight revolves around concerns about lobstering’s effects on critically endangered Wright Whales, but the situation is complicated by climate change concerns. Currently, Vinalhaven has experienced a boom. As New England’s waters have warmed lobster populations have pushed north, from southern New England to northern New England, searching for cooler waters. No one knows how long this condition will last. If waters continue warming, lobster population may, and probably will, push even further north to Nova Scotia. This is a perfect example of the anxieties that climate change causes for those that make their living from the land or sea. Climate change will cause volatility; there will be increased periods of extreme boom and extreme bust. How does a farmer or fisherman plan for that?
UMaine produces a very thorough climate review publication called Maine’s Climate Future. You can find the latest update (2020) here:
The review does a very good, accessible job of examining the expected effects on climate change. The expected effects are complicated. For example, growing periods in Maine are expected to lengthen; the spring growing season will come sooner and the fall growing season will last longer. However, the weather is expected to be more volatile. Snaps of extreme cold may threaten crops. More extreme, violent, and destructive rain events (something that has now become almost par for the course in neighboring state, Vermont), may threaten the sustainability of crops, regardless of a longer growing season. Volatility is difficult to predict and plan for.
Increased volatility in weather will mean more frequent and stronger hurricanes. As I finish typing this article (8/19/2024), my primary weather app, Windy, predicts that a massive hurricane will spin up in the Caribbean late next week and head north for New England. Long-term climate effects are easier to predict accurately than short-term weather. I’m not putting too much stock in this potential hurricane yet. It’s only a model prediction at this point.
That’s the thing about models and predictions. They’re only models and predictions until a real weather event directly touches your life. I think that’s why climate change is so difficult to grapple with. The science is complicated. The number of subjects it touches is vast. Communicating its affects accurately is difficult. Accessing accurate information is difficult. Politics is involved. The ramifications are vast to literally every person on earth.
In an air conditioned office, it’s hard to get a feel for what climate science is suggesting, and what the very real effects are that we’ve already witnessed. This is until a weather event affects you directly.
In NOVA’s excellent, new documentary: Sea Change: Bounty in the Gulf of Maine, the producers spend some time with a father-son clamming team in the Penobscot Bay area (near Vinalhaven). Due to damage to the clam fishery caused by exploding populations of European Green Crab as a result of warming waters. The fishermen have adapted by jumping on the hot fishery of the day: lobster. How long will that last? No one knows.